Big Champagne
Rebuilding the analytics dashboard for a music-data startup measuring what people were actually listening to.
Numbers
- 5
- Team size
- 4 months
- Build time
Problem
Big Champagne aggregated online music listening data from dozens of industry sources at a time when the industry's own numbers still came from sales. The data was the product, the dashboard was how major label customers got at it, and the dashboard was what competitors were being judged against.
Solution
I came onto a build the client had already reviewed and rejected a long defect list on, cleared it against a short deadline, then rebuilt the dashboard's charts to a new visual specification — adding features and improving performance, with supporting work on the Rails and JavaScript layers underneath.
Analysis
Analytics interfaces live or die on how fast someone can get from a question to a number. Everything else is decoration, and dashboards accumulate decoration faster than any other kind of product because every stakeholder wants their metric on the front page.
Arriving onto a rejected build is its own discipline. The defect list is the client's confidence, itemized, and the only way back is to clear it visibly before arguing about anything else.
Photos
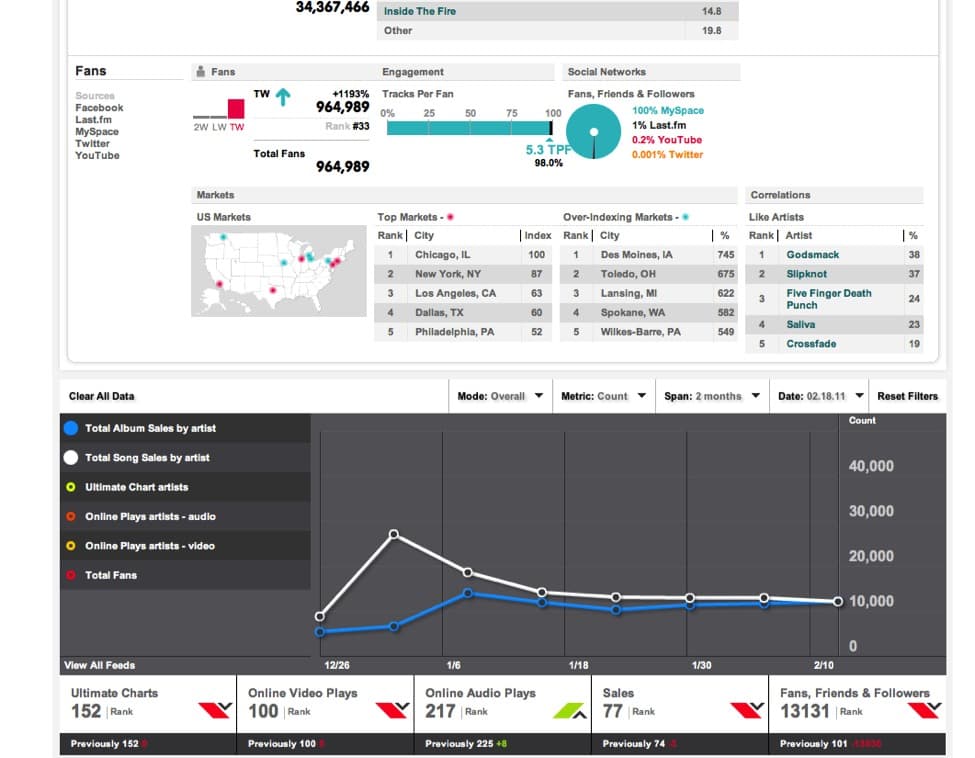
Ranked tables against a trend line — the shape every analytics product eventually arrives at.